How do you calculate ROAS and break-even ROAS, and why can a good ROAS still lose money?
ROAS (return on ad spend) is the revenue attributed to your ads divided by what you spent on them, so $3,000 of sales from $1,000 of spend is a 3.0x ROAS. Break-even ROAS is 1 divided by your contribution margin before ad spend, or price divided by price minus variable costs, so a product that keeps 39% of each sale after costs breaks even at 2.56x. Any ROAS below that line loses money, however good it looks in the ad platform.
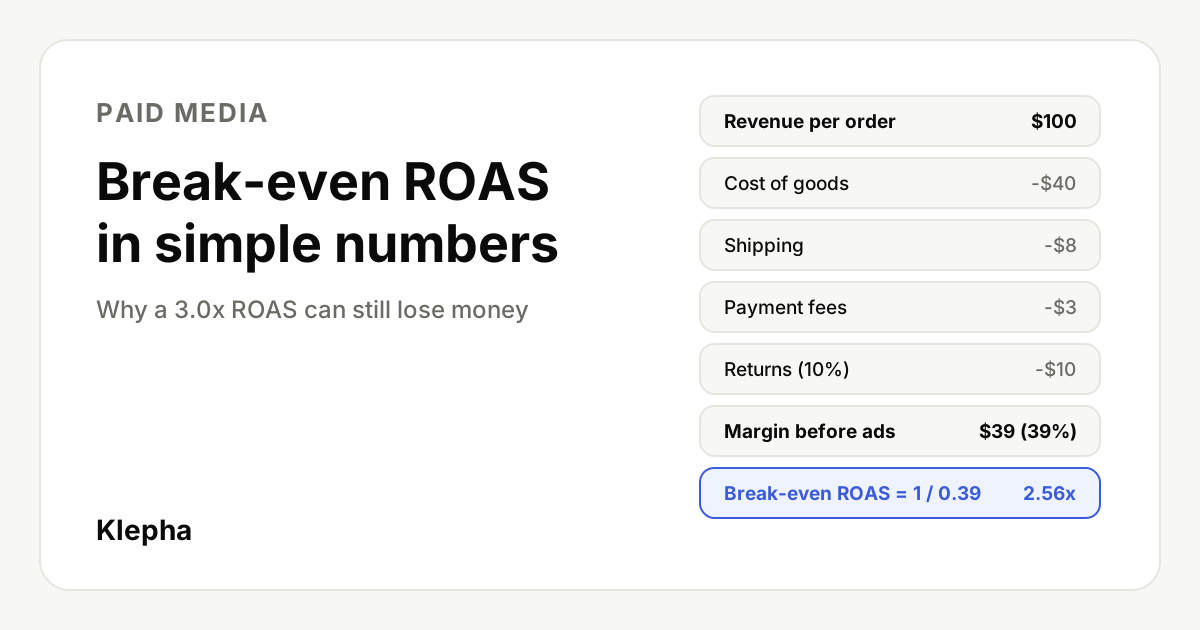
ROAS is the number most ad dashboards put front and center, and it is easy to read as profit. It is not. A 3.0x ROAS means $3 of revenue for every $1 of ads, but you still have to pay for the product, the shipping, the payment processor and the returns out of that $3. Whether anything is left depends on your margins, not on the ad platform.
This guide walks through the formulas with one simple product and round numbers, shows two ways a 3.0x campaign can lose money, and explains how to turn break-even ROAS into a target you can enter in Google Ads. All arithmetic was rechecked on November 17, 2026. Platform details follow Google Ads Help and Meta Business Help, whose pages were confirmed live the same day.
Key takeaways
- ROAS = revenue / ad spend. It measures sales per ad dollar, not profit.
- Break-even ROAS = 1 / contribution margin. A 39% margin breaks even at 2.56x. A 27% margin needs 3.70x.
- Target ROAS adds your profit goal. 1 / (margin minus desired profit). A 39% margin with a 15% profit goal needs 4.17x.
- Platform ROAS is usually optimistic. Attribution overlap, view-through credit, branded searches and returns all inflate it.
- Check with MER and POAS. Blended store revenue over total ad spend, and profit over ad spend, are harder to fool.
What is ROAS and how do you calculate it?
ROAS stands for return on ad spend. The formula is:
ROAS = revenue attributed to ads / ad spend
If a campaign costs $1,000 and the platform credits it with $3,000 in sales, ROAS is 3,000 / 1,000 = 3.0. It is usually written as 3.0x, 3:1 or 300%, which all mean the same thing. Meta reports it as purchase ROAS, and Google Ads expresses its target as a percentage.
Two details matter before you trust the number. First, "revenue" is whatever conversion value you send to the platform. If your tracking passes order totals including tax and shipping, or fires twice on a thank-you page reload, ROAS is inflated before any attribution question arises. Our guide to setting up conversion tracking before you spend on ads covers how to get that value right. Second, ROAS has no costs in it except ads. That is why it needs a break-even line to mean anything.
How do you calculate break-even ROAS?
Break-even ROAS is the ROAS at which the margin on ad-driven sales exactly pays for the ads. Above it you make money on the campaign, below it you lose money. Two equivalent formulas:
- Break-even ROAS = 1 / contribution margin before ad spend
- Break-even ROAS = price / (price minus variable costs per order)
Contribution margin here means what is left of each sale after every cost that rises with each order: cost of goods, shipping and packaging you pay, payment processing fees, the expected cost of returns, and any discount. Fixed costs such as rent and salaries are left out, because the question is whether an extra ad-driven order pays for itself.
Take a product that sells for $100:
| Line | Per order | Note |
|---|---|---|
| Price | $100 | Revenue the ad platform sees |
| Cost of goods | -$40 | Product and packaging |
| Shipping | -$8 | Paid by you, free to the customer |
| Payment fees | -$3 | About 3% of the order |
| Returns | -$10 | Expected cost if 10% of revenue is refunded |
| Contribution before ads | $39 | 39% margin |
| Break-even ROAS | 2.56x | 1 / 0.39, or 100 / 39 |
At 2.56x, $1,000 of ad spend brings $2,564 of revenue and about $1,000 of contribution, so the campaign covers itself and nothing more. Every ad dollar above that line has to be bought with ROAS above 2.56x.
The returns line is a simplification: it treats refunds as 10% of revenue and assumes returned items can be restocked. If returned goods cannot be resold, or you also pay return shipping, the cost is higher and so is break-even ROAS.
Why can a 3.0x ROAS still lose money?
On the product above, a true 3.0x ROAS is profitable: $1,000 of spend brings 30 orders, 30 x $39 = $1,170 of contribution, and $170 left after ads. The trouble starts when either the margin or the 3.0x is not what it seems.
Case 1: a discount lowers the margin. Run a 20% off sale, so the same product sells for $80. Cost of goods and shipping do not change, while fees and returns scale with the lower price:
| Full price | 20% off | |
|---|---|---|
| Price | $100 | $80 |
| Variable costs (goods, shipping, fees, returns) | $61.00 | $58.40 |
| Contribution per order | $39.00 (39%) | $21.60 (27%) |
| Break-even ROAS | 2.56x | 3.70x |
| Orders from $1,000 spend at 3.0x ROAS | 30 | 37.5 |
| Contribution from those orders | $1,170 | $810 |
| Profit after ad spend | $170 | -$190 |
The dashboard shows the same 3.0x in both columns. One makes $170 per $1,000 of spend and the other loses $190, because the discount cut the margin from 39% to 27% and pushed break-even ROAS above 3.0x.
Case 2: some of the attributed revenue was not caused by the ads. Keep full price, but suppose a quarter of the $3,000 the platform reports came from people who would have bought anyway, for example customers searching your brand name or returning buyers who saw an ad but did not need it. The incremental revenue is $2,250, a true incremental ROAS of 2.25x. That is 22.5 extra orders, $877.50 of contribution and a loss of $122.50 on $1,000 of spend, even though the platform still shows 3.0x.
The 25% figure is illustrative. The real share differs by account and can only be estimated with tests such as geographic or audience holdouts, but the logic holds for any account: if incremental ROAS is below break-even, the campaign loses money.
How do returns, discounts and shipping change break-even ROAS?
Because break-even ROAS is 1 divided by margin, small changes in margin move it a lot, and more so when margins are already thin. Starting from the $100 product:
| Scenario | Contribution margin | Break-even ROAS |
|---|---|---|
| Baseline ($40 goods, $8 shipping, 3% fees, 10% returns) | 39% | 2.56x |
| Returns rise to 20% of revenue | 29% | 3.45x |
| 20% discount (price $80) | 27% | 3.70x |
| Shipping cost rises to $12 | 35% | 2.86x |
| Cost of goods falls to $35 | 44% | 2.27x |
Two practical consequences follow. One ROAS target for a whole store is rarely right, because products with different margins have different break-even points. And promotional periods need their own break-even calculation, since the same ROAS that is profitable in an ordinary week can lose money during a sale.
What target ROAS do you need to make a profit?
Break-even is the floor, not the goal. To keep a chosen share of revenue as profit after ads, subtract that share from the margin before dividing:
Target ROAS = 1 / (contribution margin minus desired profit margin)
With a 39% contribution margin and a goal of 15% of revenue as profit after ads, target ROAS is 1 / (0.39 - 0.15) = 1 / 0.24 = 4.17x. Check: on a $100 order you can spend $24 on ads, leaving $39 - $24 = $15 of profit.
Higher targets usually mean less volume, because the bidding system has to skip auctions it expects to be less efficient. Many businesses accept a lower profit percentage in exchange for more orders, so the target is a business decision. It is not a number the ad platform can choose for you.
Why does platform ROAS overstate results?
Each ad platform reports conversions using its own attribution rules and credits itself. That produces several predictable biases:
- Overlapping credit. A customer who clicks a Google ad and later sees a Meta ad can be counted as a conversion by both, so the platforms together can claim more revenue than the store took in.
- View-through conversions. Depending on your attribution setting, Meta and other display and video platforms can count a purchase after someone only saw an ad, without clicking. Some of those people would have bought anyway.
- Branded search. Campaigns that bid on your own brand name often report very high ROAS because they capture people who were already looking for you. Some of that revenue would arrive through organic results without the ad. Reviewing negative keyword lists and keeping brand and non-brand in separate campaigns makes the difference visible.
- Retargeting. Ads shown to recent visitors and past buyers convert well partly because those people were close to buying. See our notes on retargeting with sensible caps and windows.
- Returns and cancellations. Conversion values are usually recorded at purchase and not reduced when items come back, unless you upload adjustments.
- New versus repeat customers. A sale to an existing customer is not worth the same as a new customer acquired, but ROAS treats them the same.
- Revenue versus profit. ROAS treats a $100 sale of a low-margin product the same as a $100 sale of a high-margin one.
None of this means platform ROAS is useless. It is the signal the bidding system optimizes toward and is fine for comparing campaigns within one platform. It is a poor measure of whether your advertising as a whole makes money, which is where MER and POAS come in. Consistent UTM parameters also help you compare platform claims with what your analytics records.
How much of your demand could you win without paying per click?
A free Klepha report shows whether Google and AI assistants name your brand in answers to your buyers' questions, so you can see where organic visibility could take pressure off paid spend.
Get my free reportWhat are MER, blended ROAS and POAS?
| Metric | Formula | What it tells you |
|---|---|---|
| ROAS | Attributed revenue / ad spend | Sales per ad dollar, as one platform sees it |
| Break-even ROAS | 1 / contribution margin before ads | The minimum ROAS that covers variable costs and ad spend |
| Target ROAS | 1 / (margin minus desired profit margin) | The ROAS needed to hit a chosen profit after ads |
| MER (blended ROAS) | Total store revenue / total ad spend | Overall efficiency, with no attribution overlap |
| POAS | Contribution profit before ads / ad spend | Profit per ad dollar; break-even is always 1.0 |
MER (marketing efficiency ratio), often called blended ROAS, divides all revenue in your store by all paid media spend. Suppose Google reports $30,000 from $10,000 of spend (3.0x) and Meta reports $40,000 from $10,000 (4.0x). Together they claim $70,000, but the store took $50,000 in total, including organic and direct sales. MER is 50,000 / 20,000 = 2.5x, below the 2.56x break-even of our example product. Each platform looks healthy and the business as a whole is spending more on ads than its margin supports. Some teams count all marketing costs, not only media, in MER. Whichever you choose, keep it consistent over time.
POAS (profit on ad spend) replaces revenue with contribution profit. In the full-price example, $1,170 of contribution from $1,000 of spend is a POAS of 1.17. In the discount example it is 0.81. Because profit is already netted, break-even POAS is 1.0 for every product, which makes it easier to compare products with different margins. Definitions vary, so state whether you count only cost of goods or all variable costs.
Should you judge ROAS on the first order or on lifetime value?
Break-even ROAS on the first order is the strict test: the campaign pays for itself immediately. Businesses with strong repeat purchasing can justify a lower first-order ROAS, because customers keep buying without further ad spend.
Example: if new customers from the campaign place 1.5 orders on average within 12 months, each brings 1.5 x $39 = $58.50 of contribution. The first-order break-even ROAS falls from 2.56x to 100 / 58.50 = 1.71x. That is only safe if the repeat rate comes from your own cohort data, if you can fund the gap until repeat orders arrive, and if you measure new customers separately from returning ones. Our guide to calculating CAC and LTV shows how to build those numbers and turn them into an allowable cost per customer.
How do you set target ROAS in Google Ads?
Google calls this bid strategy Target ROAS. According to Google Ads Help, it predicts the value of potential conversions and adjusts bids to maximize conversion value at the return on ad spend you set. On Search campaigns it is set as Maximize conversion value with an optional target ROAS. A few practical points:
- Enter it as a percentage. 4.17x is 417%. A $5 return per $1 of spend is 500%.
- It needs conversion values. Target ROAS optimizes whatever values you track, so values must be accurate and deduplicated first.
- Start near current performance. Google advises that a target set much higher than recent results can reduce traffic. Move toward your profit target in steps.
- Group products by margin. Products with different break-even points belong in different campaigns or have different targets. Our post on Google Ads account structure on a small budget covers how to split campaigns without spreading data too thin.
- Consider sending profit, not revenue. Some advertisers pass contribution margin as the conversion value, so that target ROAS effectively becomes a POAS target. This takes more setup and should be tested.
Meta offers similar controls, including a ROAS goal and minimum ROAS options, and the same margin logic applies. Improving conversion rate also raises ROAS at the same cost per click, which is why a strong landing page for paid traffic and disciplined A/B tests of ads and landing pages are often cheaper ways to clear break-even than cutting bids.
How do you calculate your break-even ROAS step by step?
- Take your average order value for the product or campaign, after discounts.
- List variable costs per order: cost of goods, shipping and packaging you pay, payment fees and the expected cost of returns and refunds.
- Calculate contribution margin before ad spend: (order value minus variable costs) / order value. Example: (100 - 61) / 100 = 39%.
- Divide 1 by the margin to get break-even ROAS: 1 / 0.39 = 2.56x.
- Add your profit goal for target ROAS: 1 / (0.39 - 0.15) = 4.17x, or 417% in Google Ads.
- Check against blended and incremental results. Compare platform ROAS with MER from your store data, and adjust for returns and non-incremental sales before calling a campaign profitable.
Recalculate whenever prices, supplier costs, shipping rates or return rates change, and before every major sale. For help connecting paid performance with organic and AI search visibility, see the disciplines on our expertise page and our case studies.
Sources
- Google Ads Help, "About Target ROAS bidding", link confirmed November 17, 2026. support.google.com
- Google Ads Help, "About Maximize conversion value bidding", link confirmed November 17, 2026. support.google.com
- Meta Business Help Center, "Purchases ROAS (Return on Ad Spend)", link confirmed November 17, 2026. facebook.com
- Meta Business Help Center, "About ROAS goal", link confirmed November 17, 2026. facebook.com
- Shopify, "Break-Even ROAS Calculator: How To Measure Break-Even ROAS", link confirmed November 17, 2026. shopify.com
Frequently asked questions
What is a good ROAS?
There is no universal good ROAS. A good ROAS is one above your break-even ROAS, which depends on your margins. A store with a 39% contribution margin breaks even at about 2.56x, while a store with a 27% margin needs about 3.7x just to break even.
How do I calculate break-even ROAS?
Add up the variable costs of an average order (cost of goods, shipping, payment fees, returns and discounts), subtract them from the order value to get contribution margin before ad spend, then divide 1 by that margin. A 39% margin gives 1 / 0.39 = 2.56x.
What is the difference between ROAS and POAS?
ROAS divides revenue by ad spend. POAS, or profit on ad spend, divides the profit those sales produce before ad costs by ad spend. Break-even ROAS changes with your margin, while break-even POAS is always 1.0.
Why does my ad platform show a higher ROAS than my store data?
Each platform credits itself with conversions under its own attribution rules, which can include view-through conversions and sales that would have happened anyway, such as branded searches. Platforms also usually report revenue before returns. Comparing total store revenue with total ad spend, known as MER, is a useful check.
What target ROAS should I enter in Google Ads?
Start from your break-even ROAS, add the profit margin you want, and convert it to a percentage. With a 39% margin and a 15% profit goal, target ROAS is 1 / (0.39 - 0.15) = 4.17x, entered as 417%. Begin close to the ROAS the campaign already achieves, because a much higher target can sharply reduce volume.